Wednesday, 15 January 2014

MATLAB PROGRAM FOR PCM

PCM: Pulse Code Modulation

A type of modulation in which a wave-form (an audio signal ) is being transformed into binary signal in which information is being coded in ordered pulse for transmission, or for storage, or for processing by a machine.
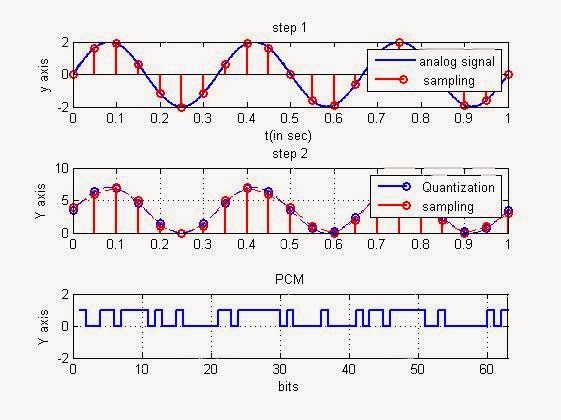
Here is a simple program for pulse code modulation which is being generated using MATLAB.

Pulse code modulation Using MATLAB
A=2;
fc=3;
fs=20;
n=3;
t=0:1/(100*fc):1;
x=A*sin(2*pi*fc*t);
ts=0:1/fs:1;
xs=A*sin(2*pi*fc*ts);
x1=xs+A;
x1=x1/(2*A);
L=(-1+2^n);
x1=L*x1;
xq=round(x1);
r=xq/L;
r=2*A*r;
r=r-A;
y=[];
for i=1:length(xq);
d=dec2bin(xq(i),n);
y=[y double(d)-48];
end

subplot(3,1,1);
plot(t,x,'linewidth',2);
title('step 1');
ylabel('y axis');
xlabel('t(in sec)');
hold on;
stem(ts,xs,'r','linewidth',2)
hold off;
legend('analog signal',' sampling');
subplot(3,1,2);
stem(ts,x1,'linewidth',2)
title('step 2');
ylabel('Y axis');
hold on;
stem(ts,xq,'r','linewidth',2);
plot(ts,xq,'--r');
plot(t,(x+A)*L/(2*A),'--b');
grid;
hold off;
legend('Quantization','sampling');
subplot(3,1,3);
stairs([y y(length(y))],'linewidth',2)
title('PCM');
ylabel('Y axis');
xlabel('bits');
axis([0 length(y) -2 2]);
grid on;

OUTPUT:
MATLAB Program to perform Inverse Discrete Fourier Transform

% Program to perform Inverse Discrete Fourier Transform:
clc;
clear all;
close all hidden;
X=input('The given i/p sequence is X(n): ');
subplot(2,2,[1,2]), stem(X);
title('i/p sequencce X(n)is:');
xlabel('---->n');
ylabel('---->X(n)');grid;
N=length(X);
for n=1:N
x(n)=0;
for k=1:N
x(n)=x(n)+X(k).*exp(1i.*2.*pi.*(n-1).*(k-1)./N);

end
x(n)=x(n)./N;
end
disp('The IDFT of the i/p sequence X(n) is x(n):')
p=0:(N-1);
subplot(2,2,[3,4]), stem(p,abs(x));
title('The IDFT of the i/p sequence X(n) is x(n):');
xlabel('---->n');
ylabel('---->x(n)');grid;
disp(x);

MATLAB PROGRAM FOR DELTA MODULATION

Delta Modulation:

Its a modulation technique which is used for transmission of voice information where quality is not of much importance.It is one of the simplest form of differential Pulse Code Modulation.
Characteristic of Delta Modulation:
     1.  Series of segments is used to approximate the analog signal.
     2.  Segment of the approximated signal is compared to the original analog signal to determine the              change  in relative amplitude.
     3.  The above process help us in establishing the state of successive bits(0 or 1).
     
Here we have a simple MATLAB program to generate delta modulated signal 

DELTA MODULATION Using MATLAB

clc;
clear all;
close all;
a=2;
t=0:2*pi/50:2*pi;
x=a*sin(t);
l=length(x);
plot(x,'r');
delta=0.2;
hold on
xn=0;
for i=1:l;
if x(i)>xn(i)
d(i)=1;
xn(i+1)=xn(i)+delta;
else
d(i)=0; xn(i+1)=xn(i)-delta;
end
end
stairs(xn)
hold on
for i=1:d
if d(i)>xn(i)
d(i)=0;
xn(i+1)=xn(i)-delta;
else
d(i)=1; xn(i+1)=xn(i)+delta;
end
end
plot(xn,'c');
legend('Analog signal','Delta modulation','Demodulation')
title('DELTA MODULATION / DEMODULATION ')

MATLAB PROGRAM FOR DATA CODING

%Pulse data coding techniques
a=[ 1 0 0 1 1];
U=a;
n=length(a);
U(n+1)=U(n);
%POLAR
P=a;
for k=1:n;
if a(k)==0
P(k)=-1;
end
P(n+1)=P(n);
end
%Bipolar
B=a;
f = -1;
for k=1:n;
if B(k)==1;
if f==-1;
B(k)=1; f=1;
else
B(k)=-1; f=-1;
end
end
B(n+1)=B(n);
end
%Mark
M(1)=1;
for k=1:n;
M(k+1)=xor(M(k), a(k));
end
%Space
S(1)=1;
for k=1:n
S(k+1)=not(xor(S(k), a(k)));
end
%Plotting Waves
subplot(5, 1, 1);
stairs(U)
axis([1 n+2 -2 2])
title('Unipolar NRZ')
grid on
subplot(5, 1, 2);
stairs(P)
axis([1 n+2 -2 2])
title('Polar NRZ')
grid on
subplot(5, 1, 3);
stairs(B)
axis([1 n+2 -2 2])
title('Bipolar NRZ')
grid on
subplot(5, 1, 4);
stairs(M)
axis([1 n+2 -2 2])
title('NRZ-Mark')
grid on
subplot(5, 1, 5);
stairs(S)
axis([1 n+2 -2 2])
title('NRZ-Space')
grid on

MATLAB PROGRAM FOR LINEAR CONVOLUTION

%linear convolution program:
clc;
clear all;
close all;
disp('linear convolution program');
x=input('enter i/p x(n):'); m=length(x);
disp(m);
h=input('enter i/p h(n):'); n=length(h);
disp(n);
x=[x,zeros(1,n)];
subplot(2,2,1), stem(x);
title('i/p sequence x(n)is:');
xlabel('---->n');
ylabel('---->x(n)');
grid;
h=[h,zeros(1,m)];
subplot(2,2,2), stem(h);
title('i/p sequence h(n)is:');
xlabel('---->n');
ylabel('---->h(n)');
grid;
disp('linear convolution of x(n) & h(n) is y(n):');
y=zeros(1,m+n-1);
for i=1:m+n-1
y(i)=0;
for j=1:m+n-1
if(j<i+1)
y(i)=y(i)+x(j)*h(i-j+1);
end
end
end
subplot(2,2,[3,4]),stem(y);
title('convolution of x(n) & h(n) is :');
xlabel('---->n'); ylabel('---->y(n)');grid;
disp(y);

MATLAB PROGRAM FOR CIRCULAR CONVOLUTION

%circular convolution program:
clc;
clear all;
close all;
disp('circular convolution program');
x=input('enter i/p sequence x(n):'); a=length(x);
disp(a);
h=input('enter i/p sequence h(n):'); b=length(h);
disp(b);
subplot(2,2,1), stem(x);
title('i/p sequence x(n)is:');
xlabel('---->n');
ylabel('---->x(n)');grid;
subplot(2,2,2), stem(h);
title('i/p sequence h(n)is:');
xlabel('---->n'); ylabel('---->h(n)');grid minor;
disp('circular convolution of x(n) & h(n) is y(n):');
if(a>b)
n=a;
else
n=b;
end
if(a-b~=0)
if(a>b)
h=[h,zeros(1,a-b)];
else x=[x,zeros(1,b-a)];
end
end
disp(x);
disp(h);
y=zeros(1,n);
for i=1:n
y(i)=0;
k=i;
for j=1:n
y(i)=y(i)+(x(j)*h(k));
if k==1
k=n+1;
end
k=k-1;
end
end
subplot(2,2,[3,4]),stem(y); title('circular convolution of x(n) & h(n) is:');
xlabel('---->n');
ylabel('---->y(n)');grid;
disp(y);

MATLAB PROGRAM FOR IIR FILTERS

% IIR filters LPF & HPF
clc;clear all;close all;
disp('enter the IIR filter design specifications');
rp=input('enter the passband ripple');
rs=input('enter the stopband ripple');
wp=input('enter the passband freq');
ws=input('enter the stopband freq');
fs=input('enter the sampling freq');
w1=2*wp/fs;w2=2*ws/fs;
[n,wn]=buttord(w1,w2,rp,rs,'s');
c=input('enter choice of filter 1. LPF 2. HPF \n ');
if(c==1)
disp('Frequency response of IIR LPF is:');
[b,a]=butter(n,wn,'low','s');
end
if(c==2)
disp('Frequency response of IIR HPF is:');
[b,a]=butter(n,wn,'high','s');
end
w=0:.01:pi;
[h,om]=freqs(b,a,w);
m=20*log10(abs(h));
an=angle(h);
figure,subplot(2,1,1);plot(om/pi,m);
title('magnitude response of IIR filter is:');
xlabel('(a) Normalized freq. -->');
ylabel('Gain in dB-->');
subplot(2,1,2);plot(om/pi,an);
title('phase response of IIR filter is:'); xlabel('(b) Normalized freq. -->');
ylabel('Phase in radians-->');


MATLAB PROGRAM FOR PSF

%Phase shift keying
clc;
clear all;
close all;
s=[1 0 1 0];
f1=10;
a=length(s);
for i=1:a
if s(1,i)==1
freq=f1*s(1,i);
for t= (i-1)*100+1:i*100
x(t)= sin(2*pi*freq*t/1000);
end
elseif s(1,i)==0
b=(2*s(1,i))+1;
freq=f1*b;
for t=(i-1)*100+1:i*100
x(t)= sin((2*pi*freq*t/1000)+pi);
end
end
end
plot(x);
xlabel('title in secs');
ylabel('amplitude in volts')
title ('PSK')
grid on

OUTPUT:

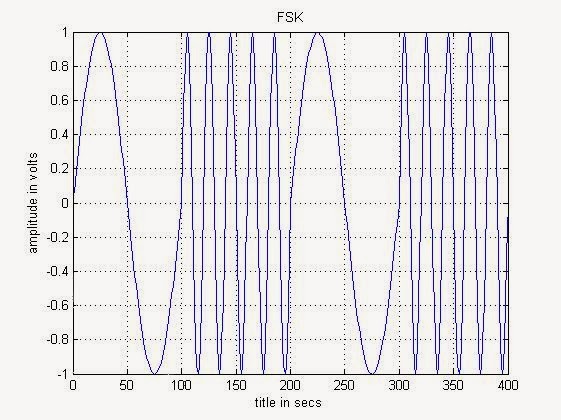
MATLAB PROGRAM FOR FSK

%Frequency shift keying
clc;
clear all;
close all;
s=[1 0 1 0];
f1=10;
f2=50;
a=length (s);
for i=1:a
if s(1,i)==1
freq=f1*s(1,i);
for t= (i-1)*100+1:i*100
x(t)= sin(2*pi*freq*t/1000);
end
elseif s(1,i)==0
b=(2*s(1,i))+1;
freq=f2*b;
for t=(i-1)*100+1:i*100
x(t)= sin(2*pi*freq*t/1000);
end
end
end
plot(x);
xlabel('title in secs');
ylabel('amplitude in volts')
title ('FSK')
grid on

OUTPUT:


MATLAB PROGRAM FOR ASK

%Amplitude shift keying
clc;
clear all;
close all;
s=[1 0 1 1 1 0];
f1=10;
a=length(s);
for i=1:a
f=f1*s(1,i);
for t=(i-1)*100+1:i*100
x(t)=sin(2*pi*f*t/1000)
end
end
plot(x)
xlabel('time in secs')
ylabel('amplitude in volts')
title('ASK')
grid on

OUTPUT:

MATLAB PROGRAM FOR TIME DIVISION MULTIPLEXING

PROGRAM:

clc;
clear all;
close all;
x=1:20;
sig1=sin(x);
l=length(sig1);
sig2=triang(l);
subplot(2,3,1);
plot(sig1,'r');
subplot(2,3,2);
plot(sig2,'g');
subplot(2,3,3);
stem(sig1,'r');
subplot(2,3,4);
stem(sig2,'g');
for i=1:l
    sig(1,i)=sig1(i);
    sig(2,i)=sig2(i);
end
tdmrg=reshape(sig,1,2*l);
subplot(2,3,[5,6]);
stem(tdmrg);

OUTPUT:

Tuesday, 14 January 2014

QUESTION BANK fOR ECE LPU

C AND DATA STRUCTURE
COMMUNICATION
CONTROL SYSTEM
DIGITAL ELECTRONICS
EDC
EMFT
MICROPROCESSOR
MICROCONTROLLER
NETWORK THEORY
SIGNAL AND SYSTEM